New York Probability Map
The New York Probability Map is a next-generation TradingView indicator that transforms over 10 years of historical backtesting data (Python + Jupyter) into real-time trading probabilities.


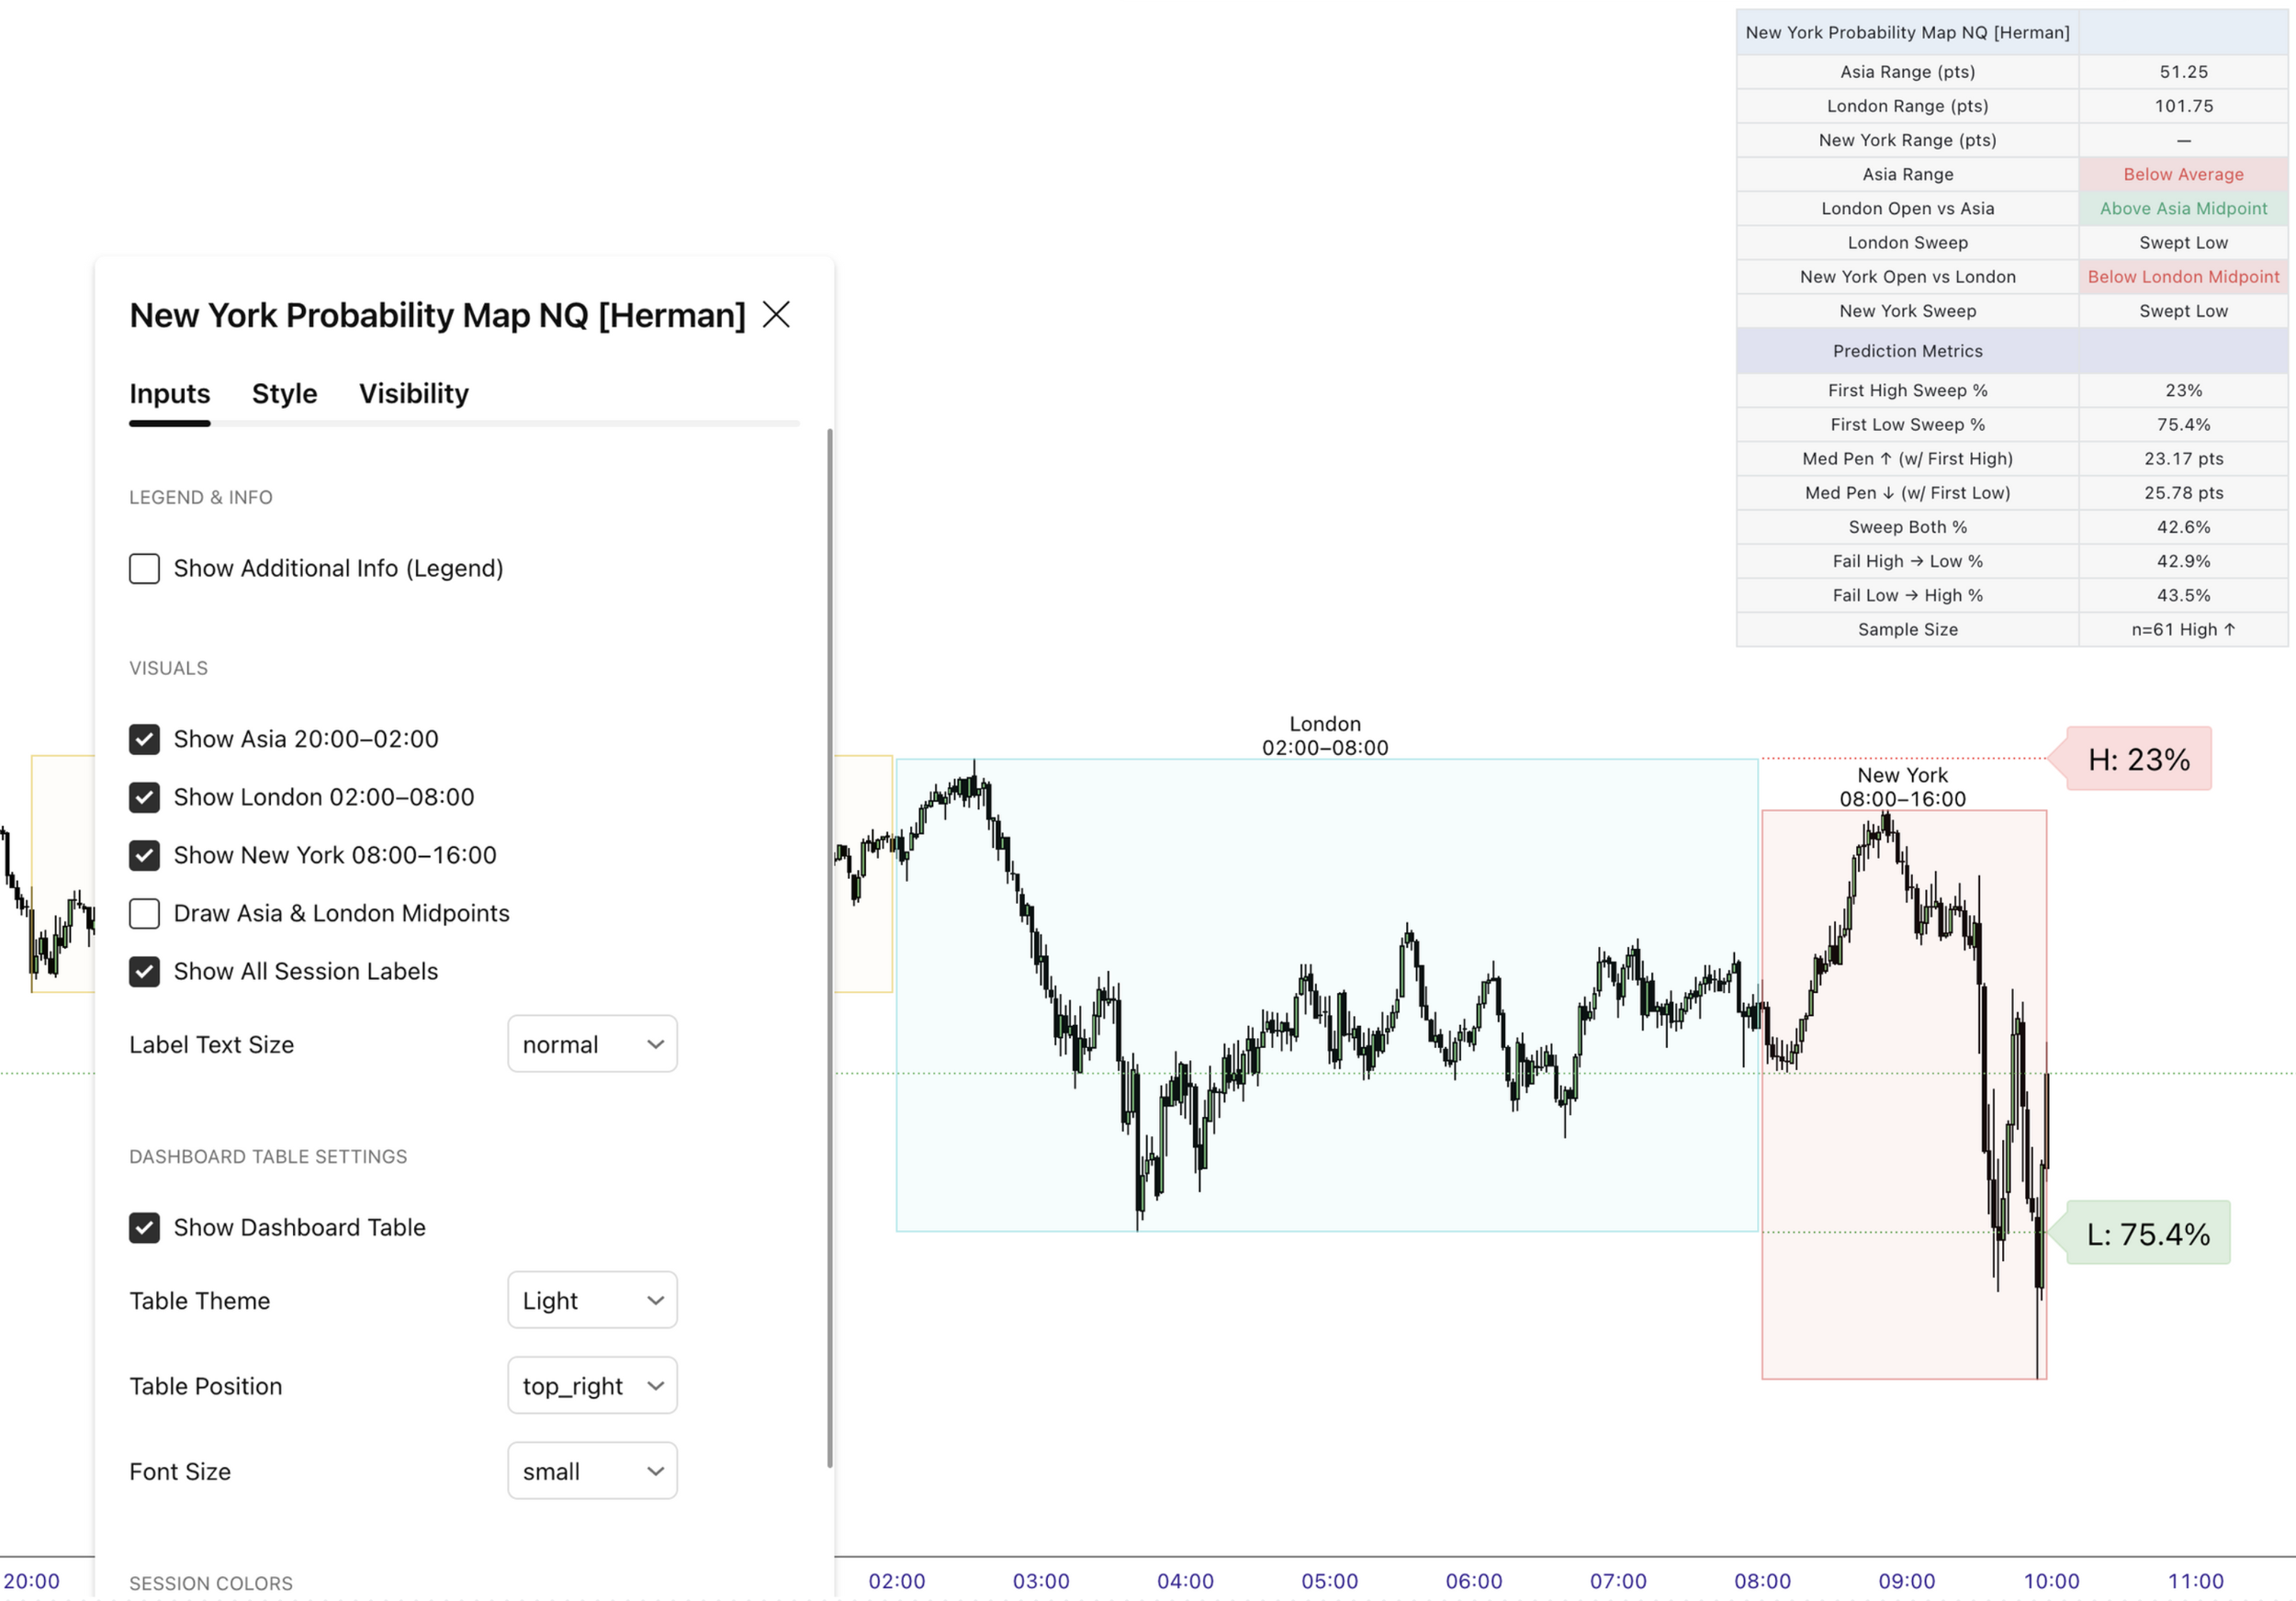


What makes it even more powerful is the 72 probability variants, dynamically adapting based on the prior Asia and London sessions


New York Probability Map
10 years of data built-in — no spreadsheets, no external files, all inside the TradingView chart.
Backtested in Python (Jupyter) — professional, research-grade methodology.
72 probability scenarios — adapting to different Asia and London session behaviors.
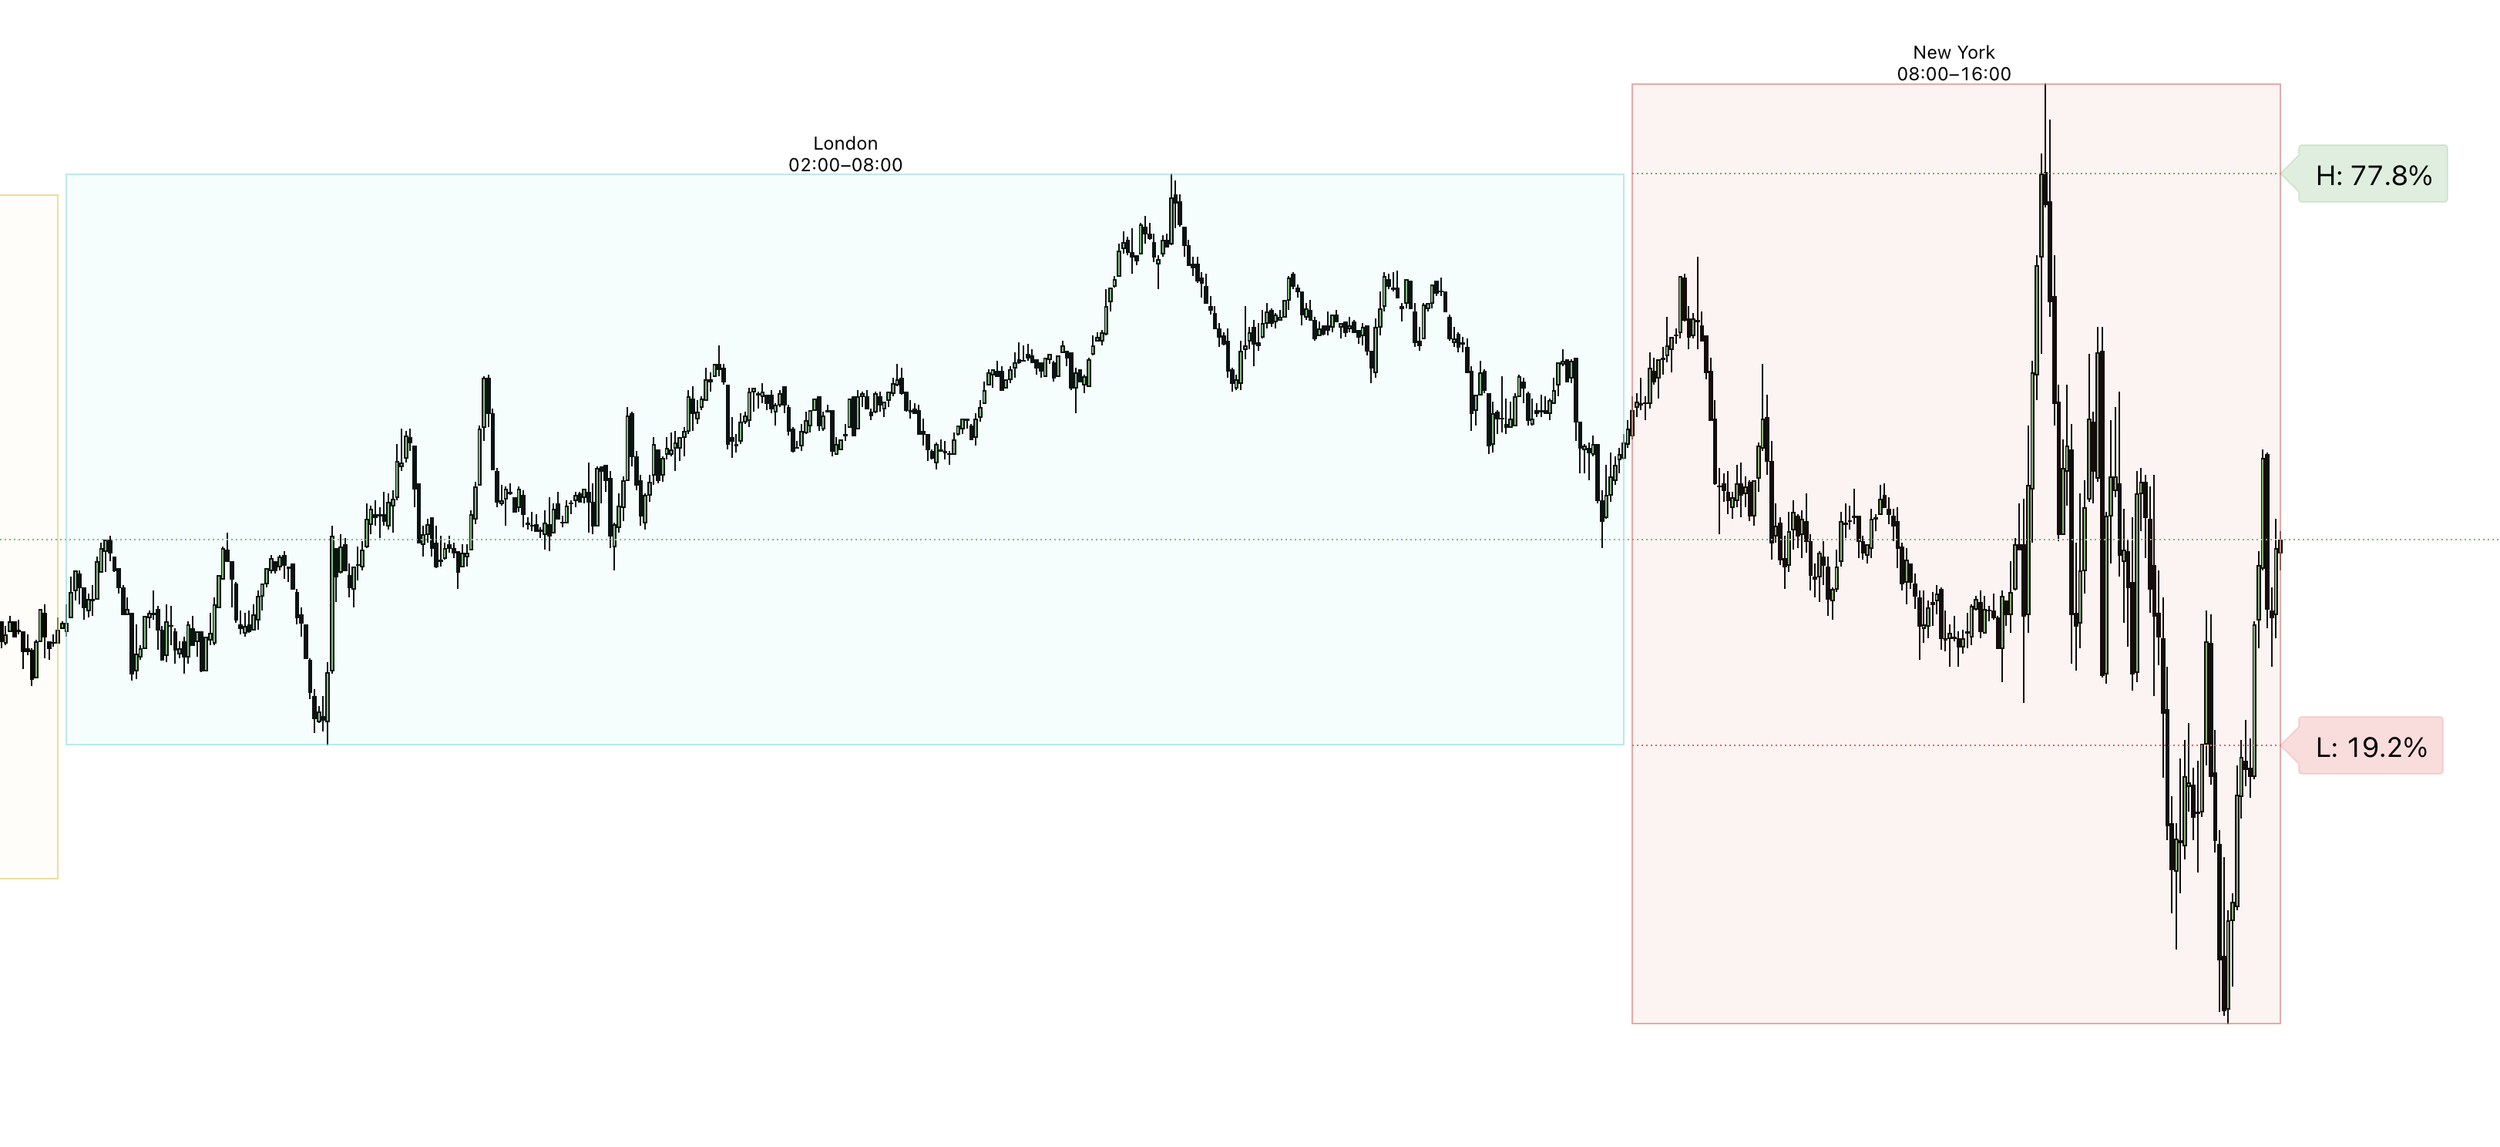
Clear NY sweep bias — instantly see the probability of sweeping London high first vs London low first.
Unique in TradingView — no other indicator has backtest data embedded at this scale.
Data-driven edge — removes guesswork and emotion, relying on historical statistics.
Seamless visualization — probabilities presented clearly, right on your chart.
Adaptive to context — probabilities shift depending on session behavior, not static numbers.
Proven statistical reliability — based on thousands of trading days since 2015.