


Premium TradingView Indicators by Herman
Trade with probabilities — not emotions.
Each Herman Trading premium indicator is designed for professional traders who value data-driven precision over assumptions.
All tools are built on verified statistical logic, extensive Python-based backtesting, and years of Nasdaq Futures (NQ) observation during the most liquid sessions — London and New York
Available Indicators:
1H Edge+ NQ – calculates the statistical probability of the previous hour’s high or low being swept first, based on ten years of historical hourly samples from Nasdaq Futures.
Asia Probability Map NQ – focuses on the overnight Asia session narrative, quantifying probabilities of the first sweep, range expansion, and reversal outcomes based on New York and Transition context.
London Probability Map NQ – focuses on the London session sweep behavior, showing whether the high or low of the session is more likely to be taken first.
New York Probability Map NQ – identifies which side of the market is statistically more likely to be swept first during the New York session, using probabilities derived from verified historical data.
OHLC Statistical Map – displays precise behavioral tendencies of Open, High, Low, and Close levels over multiple years of Nasdaq data, visualized as a clean probability manipulation/distribution map.
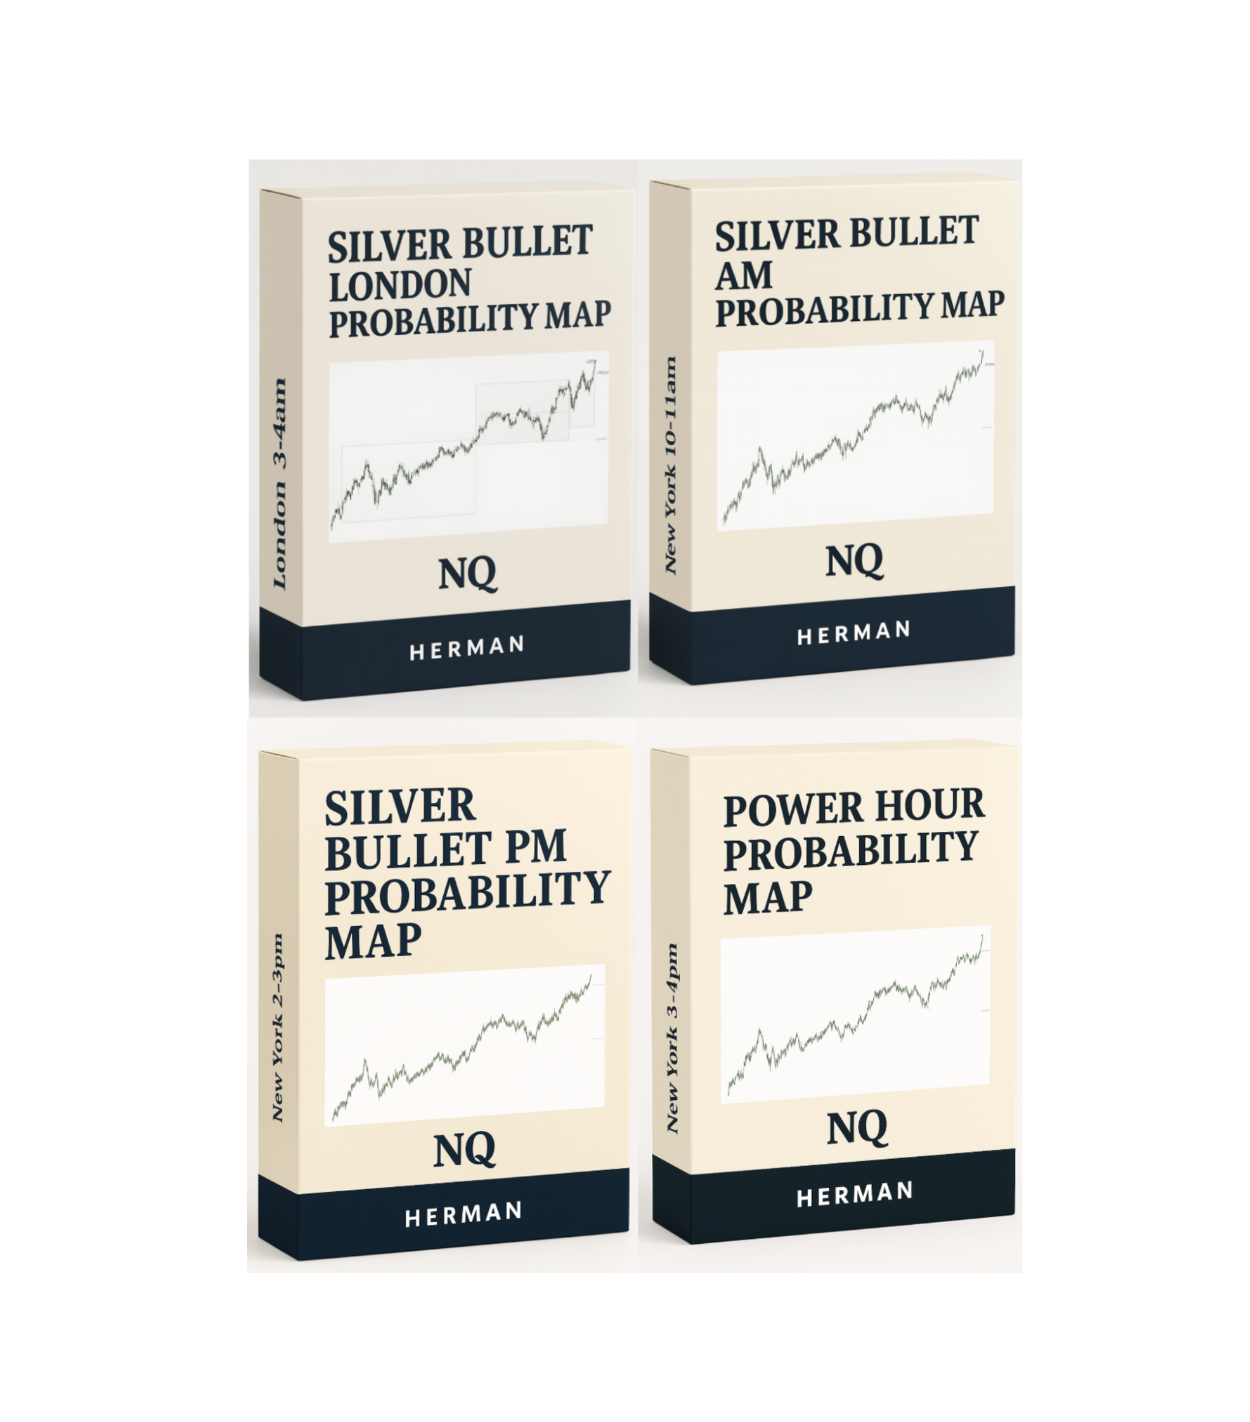
Silver Bullet Probability Map NQ – combines probabilities from London, NY AM, NY PM and Power Hour into one model built on 10 years of backtests.
GOLD Probability Maps – 4 probability-based indicators for Asia, London, New York AM and New York PM sessions on XAU/USD + GC Futures.
Built on 10 years of backtesting, it brings statistical precision to the quietest hours of the market.
Trade Smarter with Premium Indicators
Unlike traditional indicators, Herman Trading premium tools integrate real historical backtest data directly into the TradingView interface — a pioneering innovation never before available on the platform.
Built-in Historical Data (10 Years)
Indicators such as 1H Edge+ NQ, London Probability Map NQ, and New York Probability Map NQ are powered by ten years of verified Nasdaq Futures backtesting, allowing traders to instantly visualize statistical probabilities (e.g., which high or low is more likely to be swept first).
Live Statistical Mapping
The OHLC Statistical Map uses live TradingView data to display real-time statistical tendencies, highlighting areas of manipulation, distribution, and mean reversion directly on the chart.
Advanced Market Recognition
The iFVG Macro Edge is an adaptive analytical tool that detects inverted Fair Value Gaps (iFVGs) and identifies high-probability setups based on market structure and macro timing — without relying on historical datasets.
Together, these tools represent a new generation of data-integrated TradingView indicators, merging 10 years of backtesting, statistical logic, and real-time precision for traders seeking an unfair advantage built on probabilities, not emotions.
All indicators are fully compatible with TradingView, offering traders a mechanical, statistically grounded perspective that enhances confidence and precision in execution.
These aren’t traditional indicators — they’re data-driven probability models revealing how the market truly behaves.
Turning Statistics into Precision.
Explore more:
1H Edge+ NQ | New York Map | London Map | OHLC Map | iFVG Macro Edge | Silver Bullet Probability Map NQ | Asia Probability Map NQ