GOLD Probability Maps - Add-On
The GOLD Probability Maps is a next-generation TradingView indicator that transforms over 10 years of historical backtesting data (Python + Jupyter) into real-time trading probabilities.


What makes it even more powerful is the 72 probability variants, dynamically adapting.


GOLD Probability Maps Add-On
10 years of data built-in — no spreadsheets, no external files, all inside the TradingView chart.
Backtested in Python (Jupyter) — professional, research-grade methodology.
72 probability scenarios — adapting to current market structure.
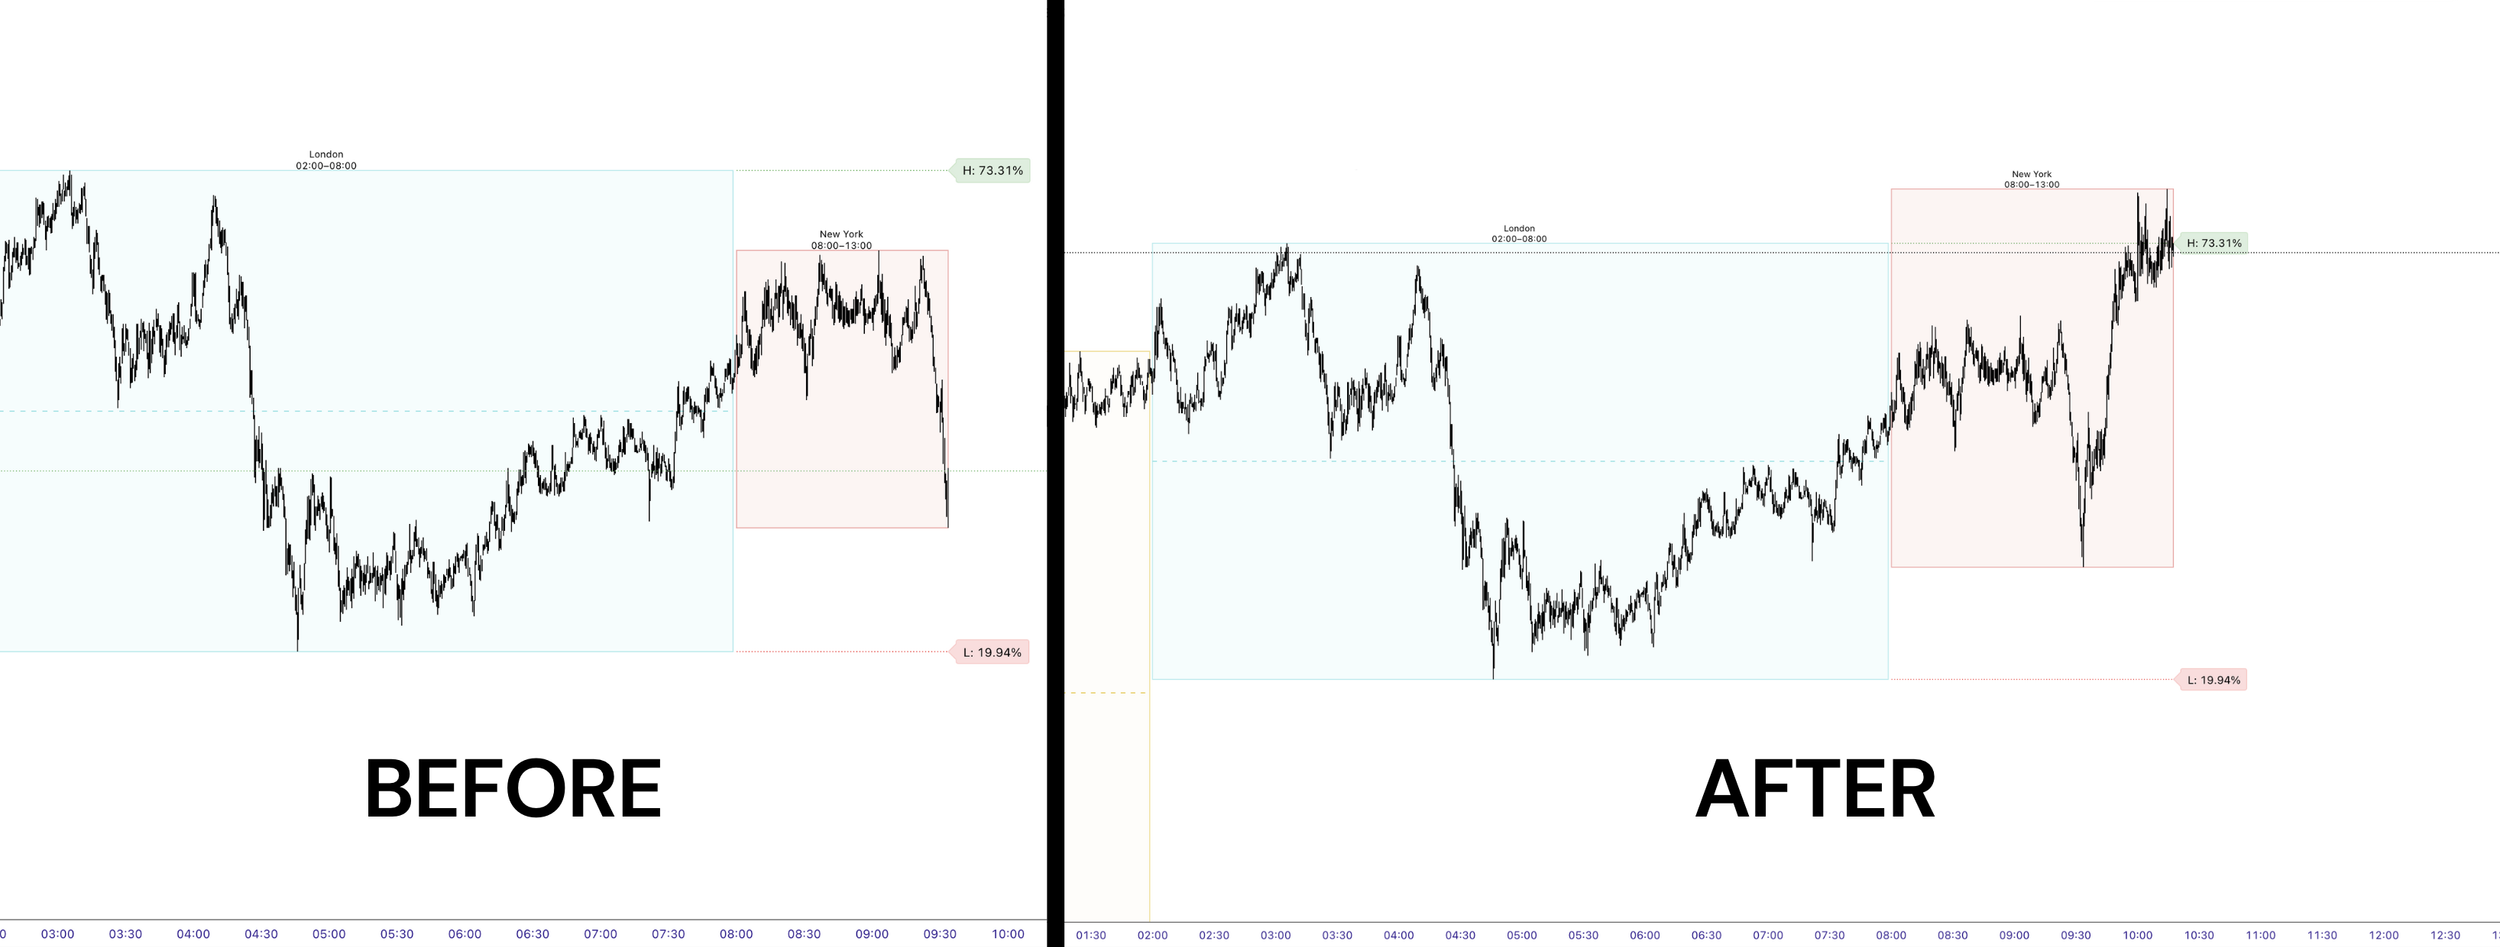
Clear sweep bias — instantly see the probability of sweeping previous session high/low.
Unique in TradingView — no other indicator has backtest data embedded at this scale.
Data-driven edge — removes guesswork and emotion, relying on historical statistics.
Seamless visualization — probabilities presented clearly, right on your chart.
Adaptive to context — probabilities shift depending on session behavior, not static numbers.
Proven statistical reliability — based on thousands of trading days since 2015.
FREE BONUS — 1H Edge+ GOLD 10 years of data built in into Trading View indicator for every 1h candle for Gold/GC